
Risk-On/Risk-Off Cycles and Semi Fund Positioning
2026-11-14

When semiconductor IPOs start popping 50-100% on their first day of trading, something has broken. Not the companies—many are genuinely innovative, well-capitalized, and positioned for long-term success. But the market signal has flipped from opportunity to warning. IPO heat in semiconductors has historically been a contrarian indicator: the hotter the IPO market, the more cautious investors should be about the sector's near-term outlook.

This isn't just folklore. There's a mechanical reason why semi IPO froth signals tops: it reflects a specific confluence of macro conditions—loose monetary policy, tight credit spreads, strong risk appetite, and elevated commodity stability—that are themselves mean-reverting. When those conditions reverse, the same IPOs that looked like genius at issuance become anchors on portfolio performance.
This post validates the contrarian signal historically, traces the macro linkage through interest rates, exchange rates, credit spreads, and commodity prices, and shows how investors can use IPO heat as a tactical tool for sector rotation. The goal isn't to avoid semi IPOs entirely—some will compound into multi-decade winners. It's to recognize when the aggregate signal is flashing red, even if individual names look compelling.
The logic is straightforward. IPOs require three things to succeed:
When all three align, IPOs flourish. But that alignment typically occurs late in the cycle—after rates have been low for an extended period, after credit spreads have tightened to cycle lows, after risk sentiment has become complacent. By the time semi IPO heat is obvious, the macro backdrop is often at its most fragile.
Consider the transmission mechanism:
But these conditions don't persist. Rates rise. Spreads widen. FX volatility returns. Commodities spike. And when they do, the IPO market freezes—often preceding broader semiconductor weakness.

Let's walk through three episodes where semi IPO heat preceded sector tops.
IPO environment: Semiconductor and internet infrastructure IPOs proliferated in 1999-2000. Names like VA Linux (up 698% on day one), Akamai, and various optical networking companies commanded eye-popping multiples. The SOX index (semiconductor index) peaked in August 2000.
Macro backdrop: Fed funds rate at 6.5% (high, but after a long easing cycle in the mid-90s), credit spreads tight, dollar strong, commodities stable. Risk appetite was extreme.
Post-IPO performance: Within 12 months, the SOX fell 70%+. Most 1999-2000 semi IPOs traded down 80-90% from IPO prices. Many never recovered.
Signal validity: High. IPO heat coincided with the cycle peak. Contrarian investors who reduced semi exposure in early 2000 avoided catastrophic losses.
IPO environment: Semiconductor IPOs returned in 2017-2018, though less frenzied than 1999-2000. Names like Mellanox (secondary offering), various AI chip startups, and memory-related equipment companies saw strong demand. The SMH ETF peaked in January 2018.
Macro backdrop: Fed funds rate rising from 1.25% to 2.5%, credit spreads tight (HY spread ~300 bps), dollar weakening, commodities stable. Risk appetite remained strong despite rate hikes.
Post-IPO performance: Within 12 months, the SMH fell 35% from peak to trough (late 2018). Many 2017-2018 IPOs underperformed the broader semi index by 20-30%.
Signal validity: Moderate. IPO heat didn't mark the exact top, but it signaled late-cycle dynamics. Contrarian investors who trimmed exposure in early 2018 reduced drawdowns.
IPO environment: Semiconductor IPOs surged in 2021-2022, driven by AI, chiplets, and advanced packaging themes. Names like Cerebras (private rounds at IPO-like valuations), various AI accelerator startups, and equipment companies saw intense investor interest. The SMH peaked in November 2021.
Macro backdrop: Fed funds rate near zero, credit spreads extremely tight (HY spread ~250 bps), dollar weak, commodities beginning to rise. Risk appetite was at cycle highs.
Post-IPO performance: Within 12 months, the SMH fell 40% from peak to trough (late 2022). Many 2021-2021 IPOs and late-stage private rounds were marked down 50-70% in subsequent financing.
Signal validity: High. IPO heat coincided closely with the cycle top. Contrarian investors who reduced exposure in late 2021/early 2022 preserved capital.
Why does IPO heat correlate with cycle tops? Because it reflects a specific macro regime—one that's inherently unstable and prone to reversal. Let's trace the linkage through each factor.
Semiconductor IPOs thrive when interest rates are low or falling. Low rates compress discount rates, inflating valuations for growth stocks. A company projecting $100 million in revenue five years out is worth far more at a 3% discount rate than at a 7% discount rate.
But low rates don't persist indefinitely. When inflation picks up, growth accelerates, or central banks pivot, rates rise. And when rates rise, growth stock valuations compress—especially for unproven IPOs with no earnings to anchor multiples.
Monitor the 10-year Treasury yield and the Fed funds futures curve. When the 10-year yield is below 3% and the market is pricing in rate cuts, IPO heat is sustainable. When the 10-year yield rises above 4-4.5% and the market is pricing in rate hikes, IPO heat is a warning signal.
Stable or weak dollar conditions support semi IPOs. A weak dollar makes U.S. semiconductor exports more competitive, boosting revenue growth projections for IPO candidates. It also encourages foreign investment in U.S. tech IPOs, increasing demand.
But when the dollar strengthens—on rate differentials, safe-haven flows, or relative growth dynamics—semi IPOs face headwinds. Foreign demand wanes. Export competitiveness declines. Revenue projections are downgraded.
Monitor the DXY index and USD/JPY. When DXY is below 100-102 and USD/JPY is above 145-150, IPO conditions are favorable. When DXY rises above 105-110 and USD/JPY falls below 135-140, IPO heat is a contrarian warning.
Tight credit spreads signal risk appetite. When high-yield spreads are below 300-350 basis points, investors are willing to take risk on unproven names. IPO underwriters can price deals aggressively, knowing institutions will absorb the supply.
But tight spreads are mean-reverting. When spreads widen—on growth concerns, credit events, or liquidity stress—IPO demand evaporates. Institutions prioritize liquidity over speculation. Secondary offerings are postponed. PIPE financing becomes expensive or unavailable.
Monitor the ICE BofA High-Yield Index spread. When spreads are below 300 bps, IPO heat is sustainable. When spreads widen above 400-450 bps, IPO heat is a warning signal—liquidity is deteriorating even if equity markets haven't yet reflected it.
Stable commodity prices support semi IPOs. Copper, oil, and rare earth prices affect semiconductor production costs. When commodities are stable, IPO candidates can project margins with confidence. Underwriters can model profitability without major uncertainty.
But commodity spikes create cost uncertainty. Copper above $4.50-5.00/lb, oil above $90-100/barrel, and rare earth price volatility all compress margins for semiconductor manufacturers. IPO candidates face downgraded projections, and aftermarket performance suffers.
Monitor copper and oil prices. When copper is below $4.00/lb and oil is below $80/barrel, IPO conditions are favorable. When copper rises above $4.50-5.00/lb and oil exceeds $90-100/barrel, IPO heat is a contrarian warning—input cost inflation is building.
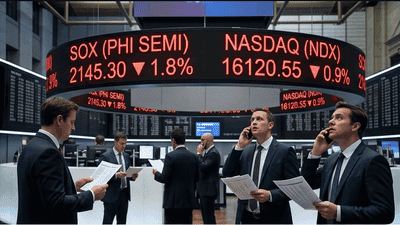
Can we quantify IPO heat? Yes—by combining several metrics into a composite index. Here's a framework:
Normalize each metric to a 0-100 scale (0 = cold, 100 = hot). Weight them equally or tilt toward first-day pops and proceeds raised (most sensitive to sentiment). The composite index ranges from 0-100:
Backtest the index against historical semi cycle peaks. Adjust thresholds based on empirical performance. For example, if the index reading above 75 has historically preceded 20%+ semi corrections within 12 months, use 75 as the sell signal threshold.
The goal isn't perfection—it's probabilistic edge. An IPO heat index won't call every top, but it will flag late-cycle dynamics that traditional valuation metrics might miss.
How do you actually use this signal? Several approaches:
When the IPO heat index crosses into the 70-80+ range, reduce semiconductor exposure by 20-30%. Rotate into defensive sectors (utilities, consumer staples) or increase cash. This doesn't mean exiting entirely—just reducing beta to preserve capital if the cycle turns.
Within semiconductor holdings, tilt toward quality: cash-rich balance sheets, positive FCF, pricing power, secular growth exposure (AI, data center). Avoid leveraged names, unproven business models, and companies dependent on continuous capital raising. IPO heat signals that cheap capital is about to get expensive—position accordingly.
Use put options on semiconductor ETFs (SMH, SOXX, PSI) to hedge downside risk when IPO heat is elevated. The cost of protection is justified by the asymmetric risk: if the signal is right, you avoid large losses; if it's wrong, you lose the premium but retain upside participation.
If you participate in semi IPOs, do so selectively. Avoid names with first-day pops above 50-75%—the aftermarket performance is typically poor. Focus on companies with strong fundamentals, reasonable valuations, and secular growth drivers. And size positions small—IPOs are lottery tickets, not core holdings.

There's a behavioral element to IPO heat. When IPOs are popping, investors feel like they're missing out. FOMO kicks in. Capital flows into the sector, driving valuations higher, which attracts more IPOs, which drives more FOMO. It's a self-reinforcing cycle—until it isn't.
The contrarian investor must resist this pull. It's uncomfortable to reduce exposure when everyone else is chasing. It's awkward to sit on cash while IPOs pop 50-100% on day one. But history shows that discomfort is the price of capital preservation.
The key is framing: you're not betting against innovation or long-term semiconductor growth. You're betting against the sustainability of a specific macro regime that enabled frothy valuations. When that regime reverses—as it always does—you'll have dry powder to deploy at better prices.
Semi IPO heat as a contrarian indicator is a microcosm of a broader principle: sentiment extremes signal mean reversion. It's not just IPOs—valuation multiples, analyst optimism, positioning data, and macro conditions all exhibit cyclical patterns. The investor's job is to recognize when multiple signals align and position accordingly.
IPO heat is particularly useful because it's observable, quantifiable, and historically validated. You don't need proprietary data or complex models. You need to count IPOs, track first-day pops, monitor macro conditions, and have the discipline to act when the signal flashes.
For semiconductor investors, the payoff is asymmetric. When the signal is right, you avoid 20-40% drawdowns. When it's wrong, you underperform by a few percent in a continuing rally. That's favorable risk-reward.
Semiconductor IPOs will continue. Innovation will persist. New companies will emerge to challenge incumbents, drive technological progress, and create long-term value. But the aggregate IPO market is also a sentiment gauge—and when it's running hot, caution is warranted.
The historical validation is clear: 1999-2000, 2017-2018, 2021-2022. Each episode featured semi IPO froth. Each episode preceded significant sector corrections. The macro linkage—through rates, FX, credit, commodities—explains why the signal works. And the portfolio implications—tactical reduction, quality tilt, hedging, IPO discipline—provide a roadmap for acting on it.
IPO heat is not a timing tool. It won't tell you the exact top. But it will tell you when the risk-reward has shifted—when the macro backdrop is fragile, when valuations are stretched, when liquidity is about to tighten. And that's enough to inform positioning.
The IPOs are popping. The signal is flashing. The history is clear. Position accordingly.